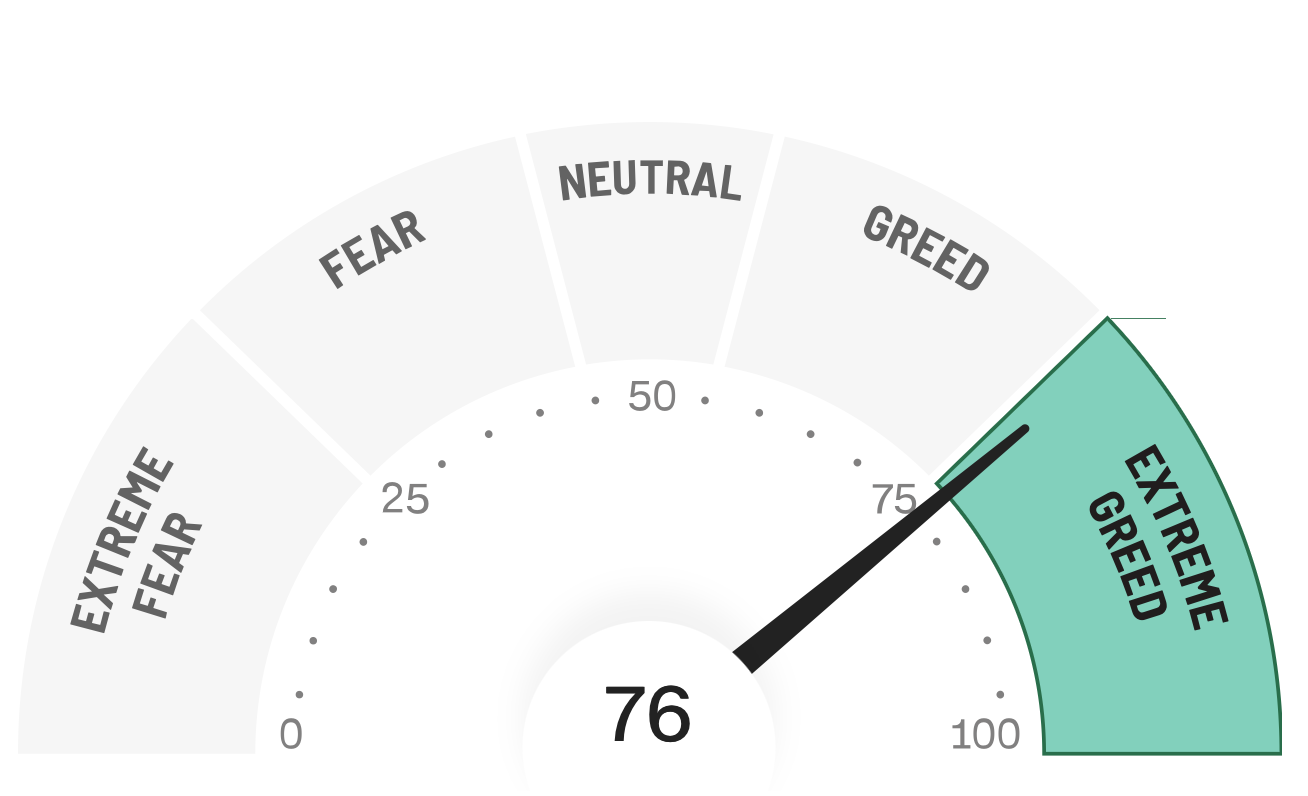
There is 1 sign of greed in the market. Today we are at Greed. Tomorrow will hit Extreme Greed? These charts at first seem very silly. You may wonder if they come from some completely sill reader’s poll that is biased in some way. Actually no, it’s made up of a combination of these metrics
Market Momentum, as measured by the S&P 500 and it’s 125-day moving average
If the index is above the 125 day, it’s deemed bullish so greed prevails.
Stock Price Strength as measured by net 52 week highs and lows on the NYSE
Measures how many net new stocks are at their 52 week highs or lows. When there are more net new highs than lows, it’s deemed bullish.
Stock Price Breadth as measured by the McClellan Volume Summation Index
Number of overall stocks that are rising or falling. More rising is bullish and that signals greed.
Puts and Calls from Options Traders, as measured by the 5-day average put/call ratio
When options traders (generally buyers in this context) buy more calls than puts, that’s bullish, but when they buy more puts than calls, this is thought of as bearish, as more folks are buying “insurance” to hedge a fall in the market.
Market Volatility – Let’s not forget the CBOE Volatility Index VIX after all!
The VIX is an index that it’s tradable and usually spikes when there is a huge drop, and drops quickly when the bulls get control.
Safe Haven Demand measured by the difference in 20-day stock and bond returns
Junk Bond Demand as measured by the yield spread between junk bonds and investment grade bonds.


